Previously we have determined what our dataset is about and how many rows/columns it has.
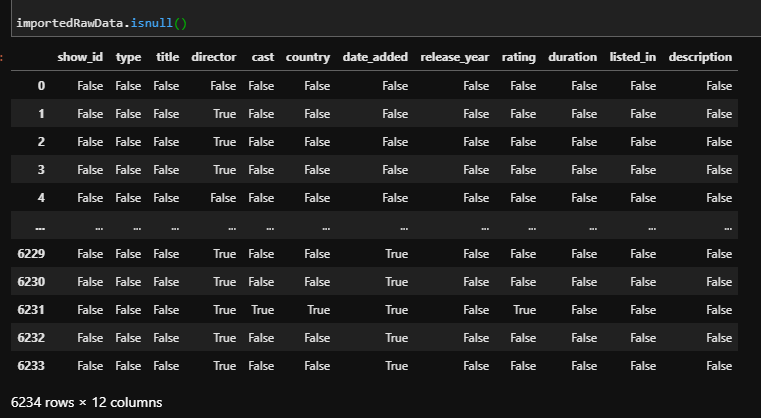
We also checked which cells are empty or not using the isnull() function[1].
However, reading that table cell by cell would take a lot of time. Luckily, adding .sum() at the end would count the missing cells for us:

Now that we know what is and isn't missing, we can decide what we want to do with the information we have.
First, let's remove the columns we won't use.
To remove a column from a dataset we need to use the .drop(columns = ["column1", "column2", ...]) command.
Here are the columns we will remove:

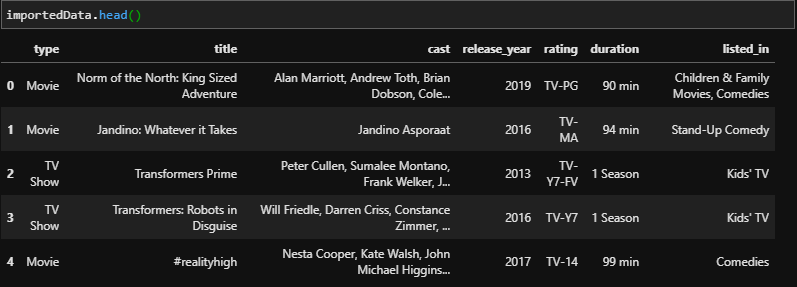
If we were to run head or tail again, we would get a cleaner output.
The next step is deciding what we want to analyze and start analyzing. We will do that in the next workout.
Here is all the work we have done in this blog series within a Google Collab Notebook.
If you want to continue reading, download our Enki App and subscribe to the Python Data Analysis topic.
Footnotes
[1:Previous Dataset]
Using the .isnull() function on a DataFrame will give us a table of True/False values.


